> ## Documentation Index
> Fetch the complete documentation index at: https://meilisearch-6b28dec2-add-platform-documentation.mintlify.site/llms.txt
> Use this file to discover all available pages before exploring further.
# Indexing performance
> Track indexing latency and debug individual batch performance for your Meilisearch Cloud project.
The indexing performance section of the monitoring dashboard shows how quickly Meilisearch processes indexing tasks. It is labeled **Beta** in the Cloud UI.
You can filter all charts by index using the **All indexes** dropdown, set a date range, or enable real-time mode. Timestamps are displayed in UTC.
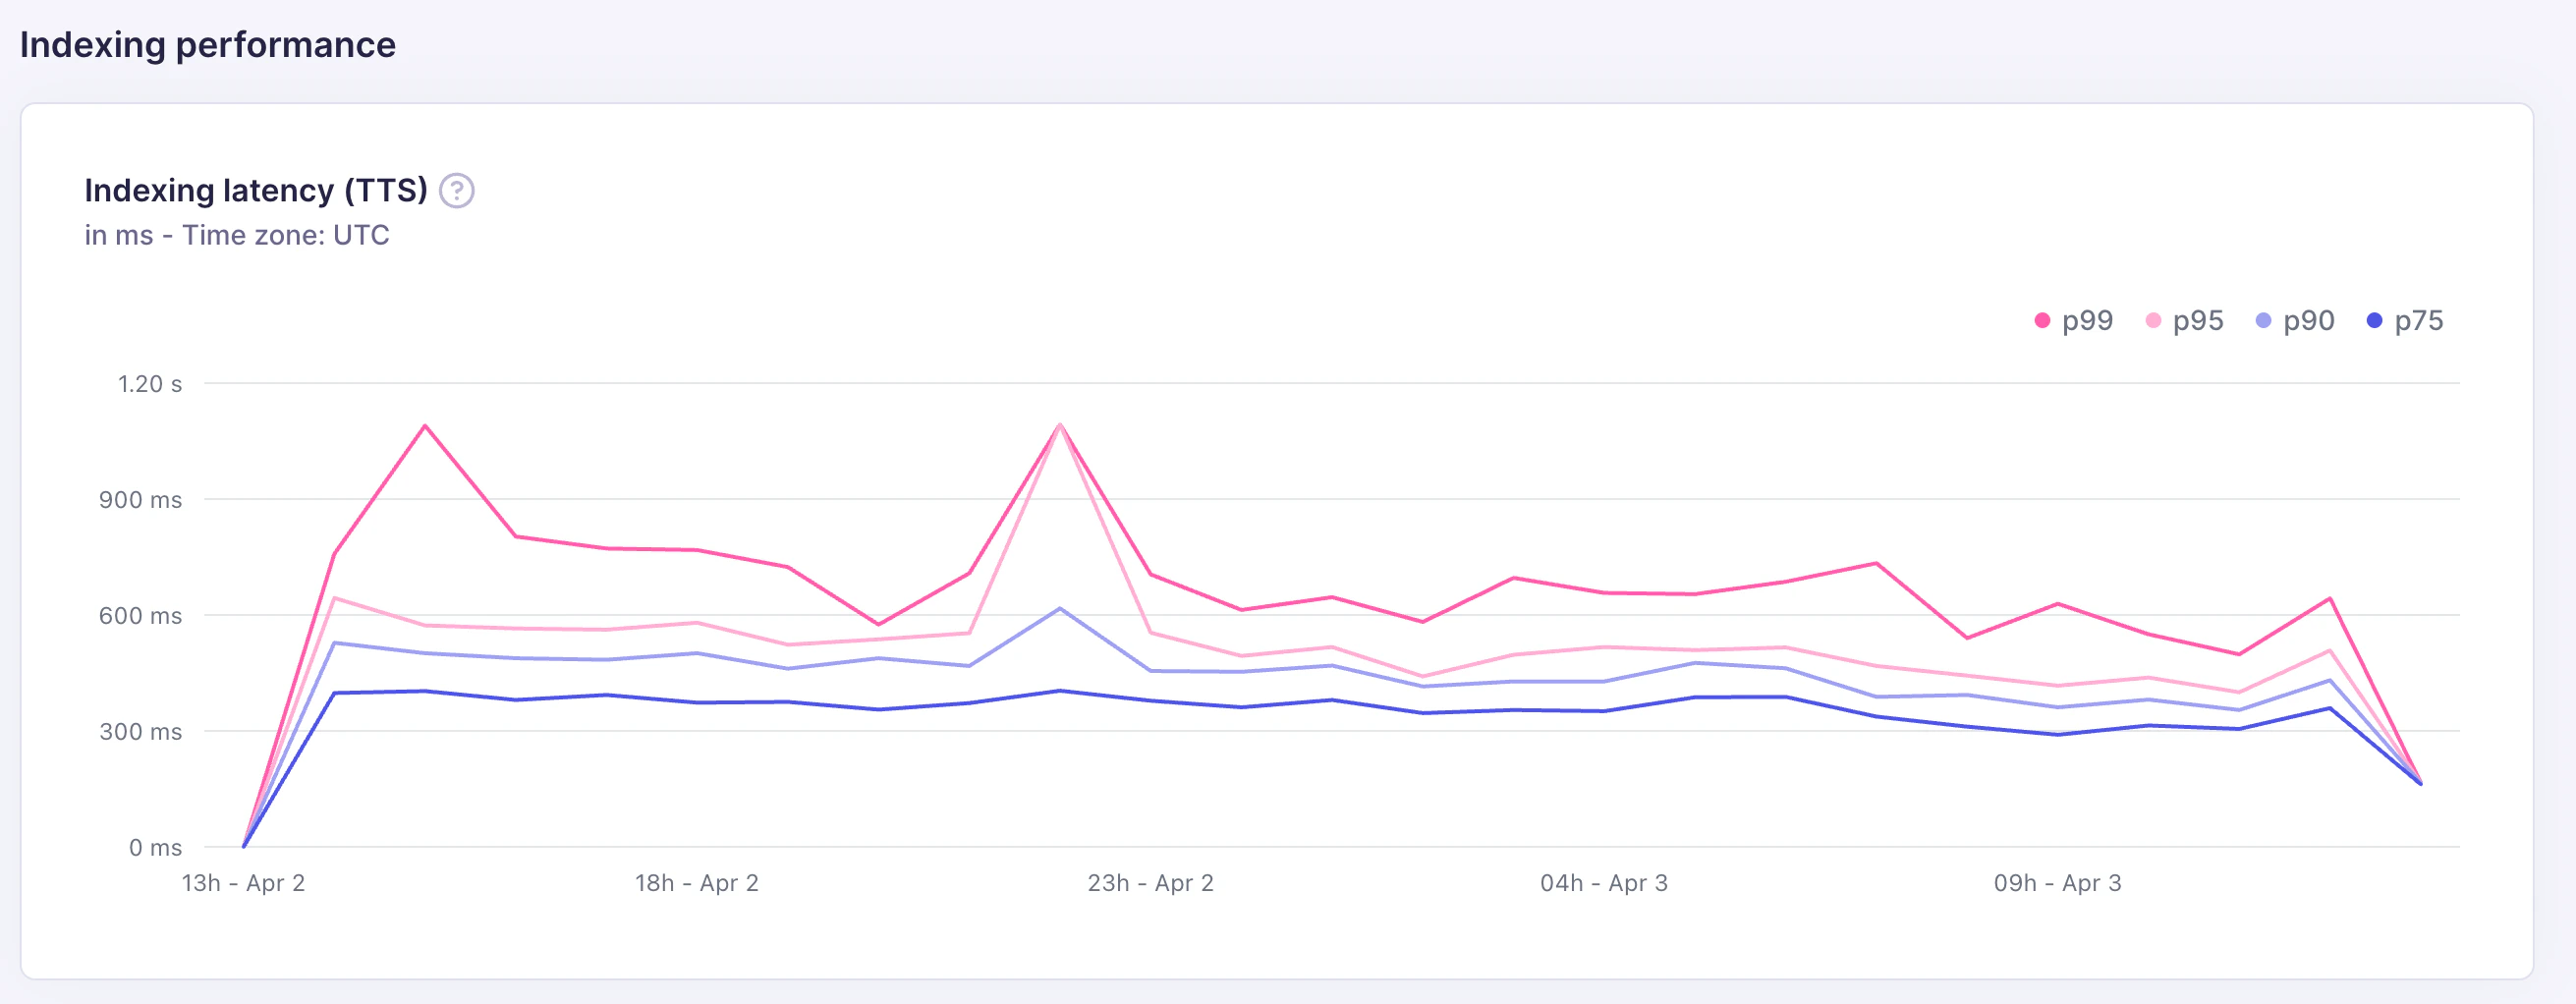
## Indexing latency (TTS)
The indexing latency chart tracks **time-to-search (TTS)**: the time from when an indexing task is enqueued to when the indexed documents become searchable. Latency is shown at four percentiles, measured in milliseconds: **p75**, **p90**, **p95**, and **p99**.
 | Percentile | What it means |
| ---------- | -------------------------------------------------------------------- |
| **p75** | 75% of indexing tasks completed within this time |
| **p90** | 90% of indexing tasks completed within this time |
| **p95** | 95% of indexing tasks completed within this time |
| **p99** | 99% of indexing tasks completed within this time — the slowest tasks |
TTS is the metric that matters most for use cases where freshness is important, such as e-commerce catalog updates or live content indexing.
## Batches
The **Batches** tab gives you a per-batch view of every indexing operation, along with a detailed trace of where time was spent. Use it when the TTS chart shows high latency and you need to identify the bottleneck.
| Percentile | What it means |
| ---------- | -------------------------------------------------------------------- |
| **p75** | 75% of indexing tasks completed within this time |
| **p90** | 90% of indexing tasks completed within this time |
| **p95** | 95% of indexing tasks completed within this time |
| **p99** | 99% of indexing tasks completed within this time — the slowest tasks |
TTS is the metric that matters most for use cases where freshness is important, such as e-commerce catalog updates or live content indexing.
## Batches
The **Batches** tab gives you a per-batch view of every indexing operation, along with a detailed trace of where time was spent. Use it when the TTS chart shows high latency and you need to identify the bottleneck.
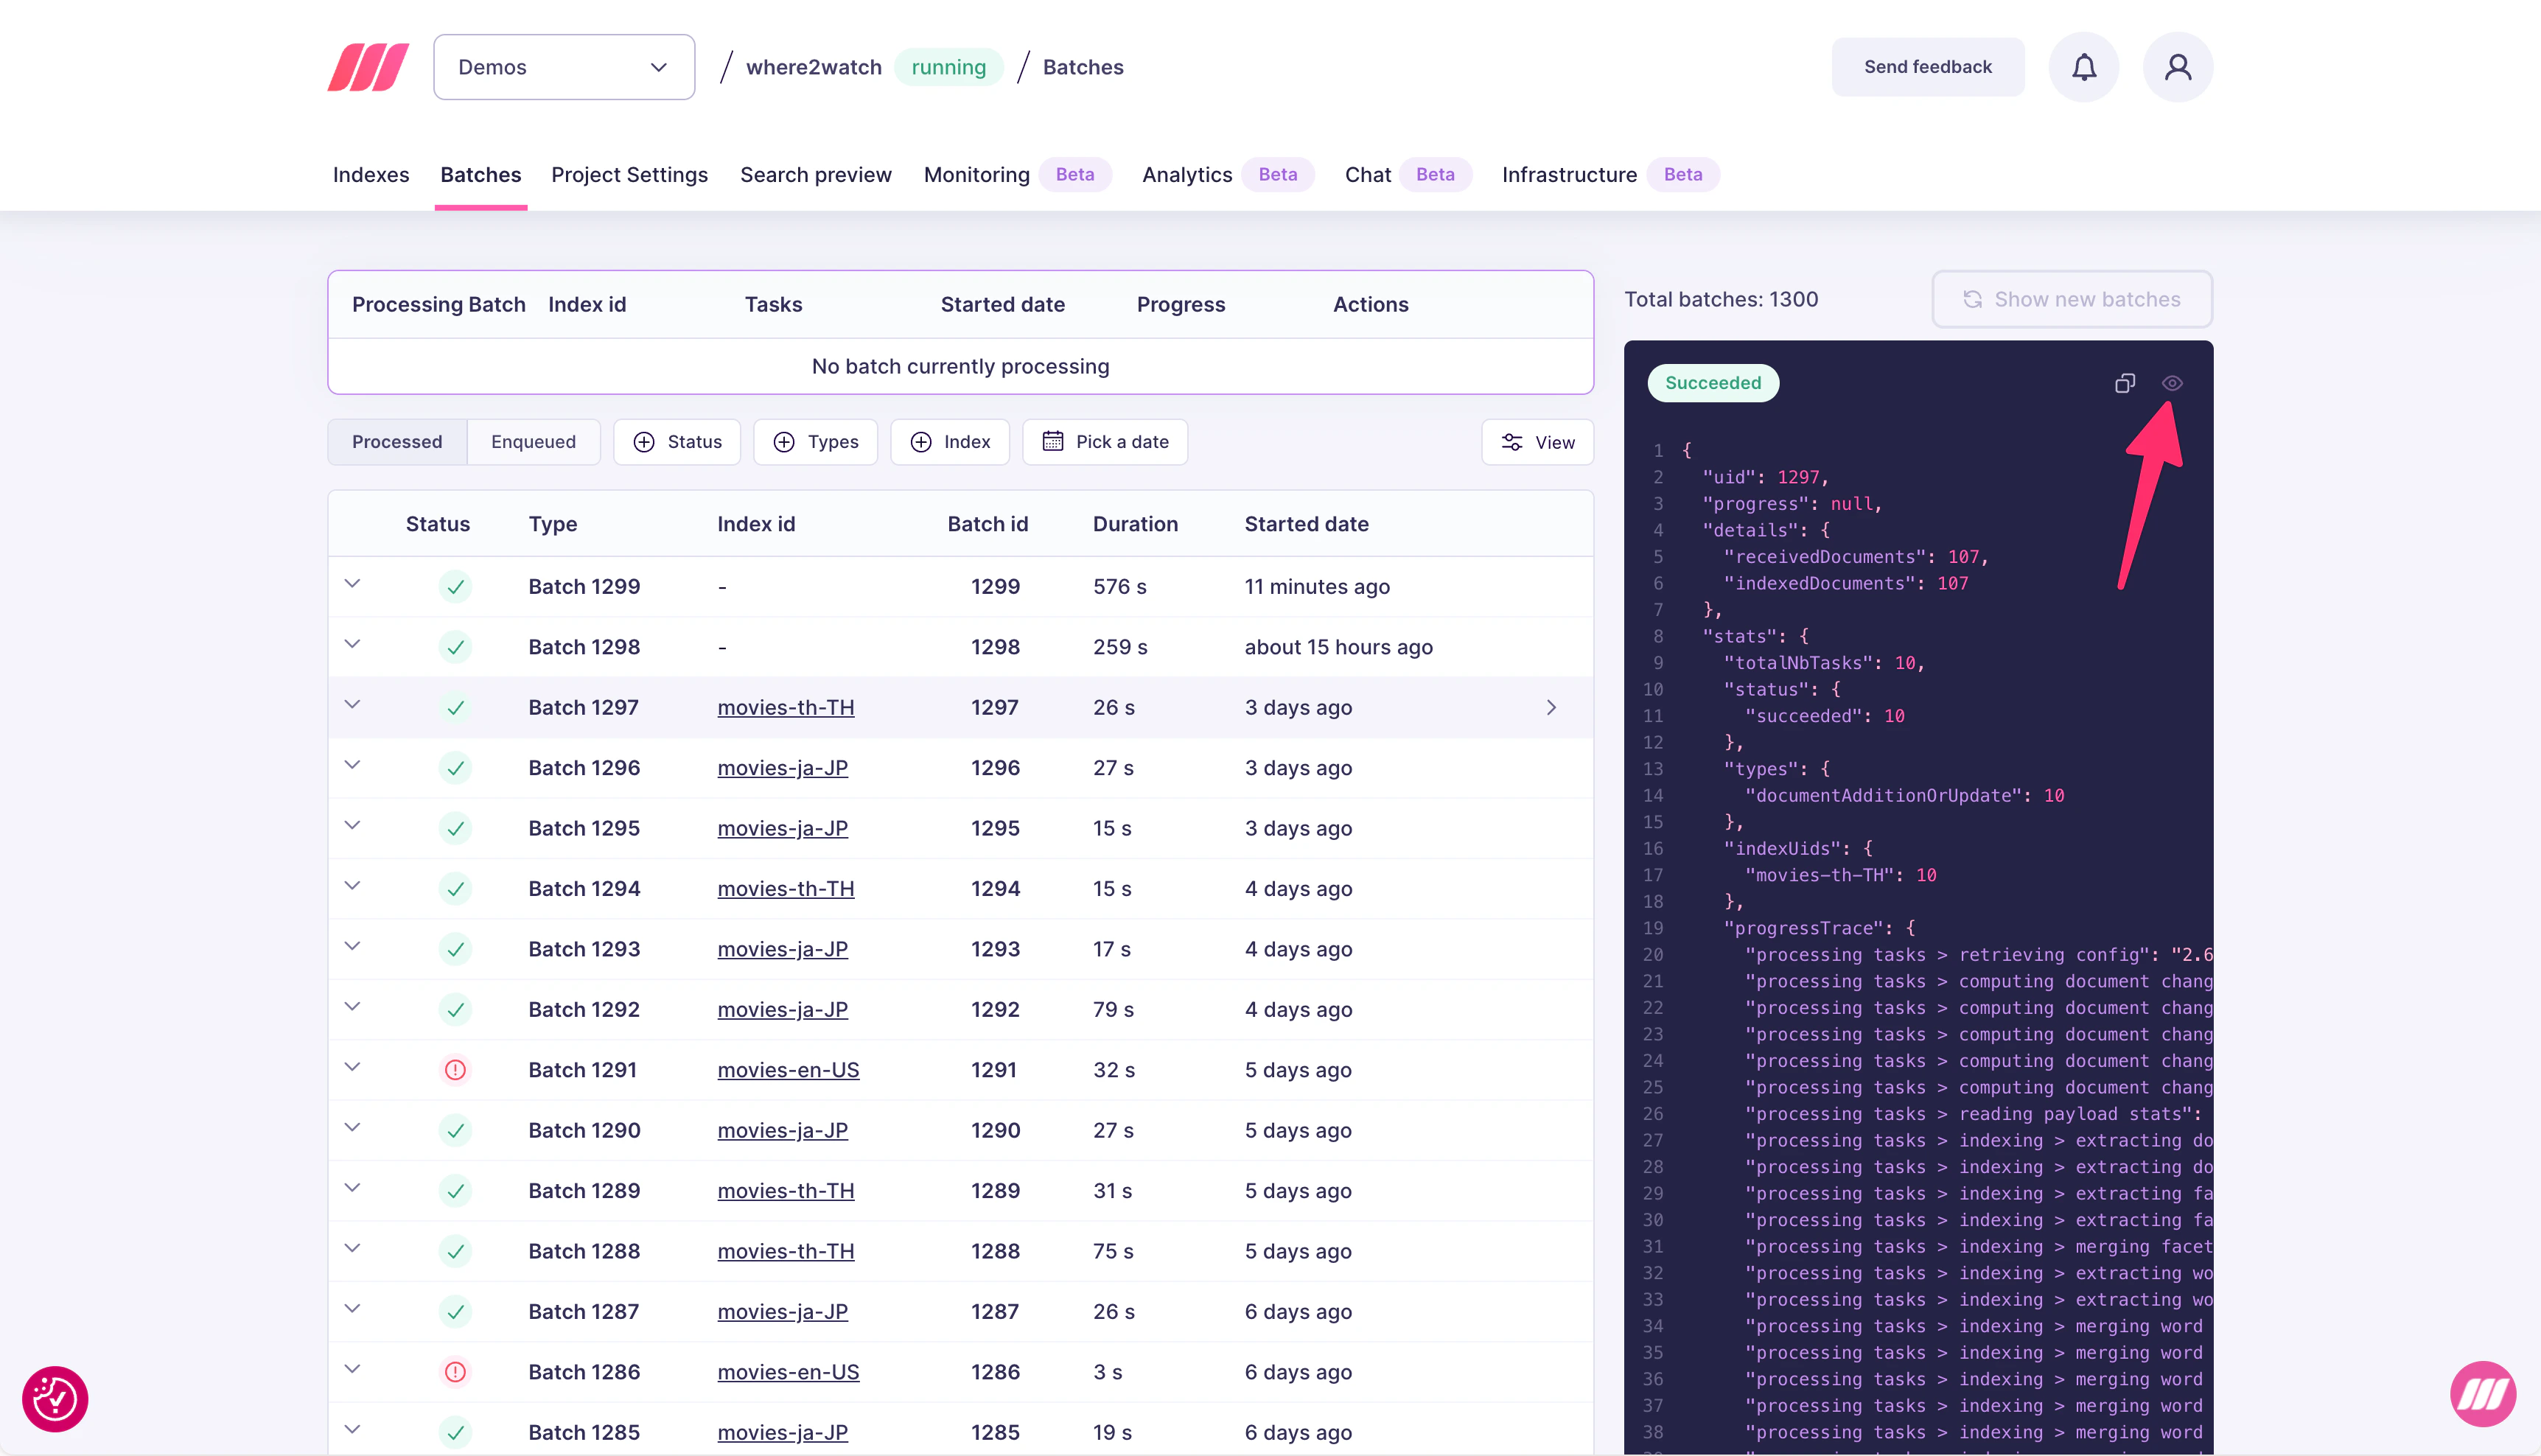 Each row shows:
* **Status**: succeeded, failed, or in progress
* **Index id**: which index was written to
* **Batch id**: unique identifier for the batch
* **Duration**: total wall-clock time for the batch
* **Started date**: when the batch began processing
Click a batch to open its details page.
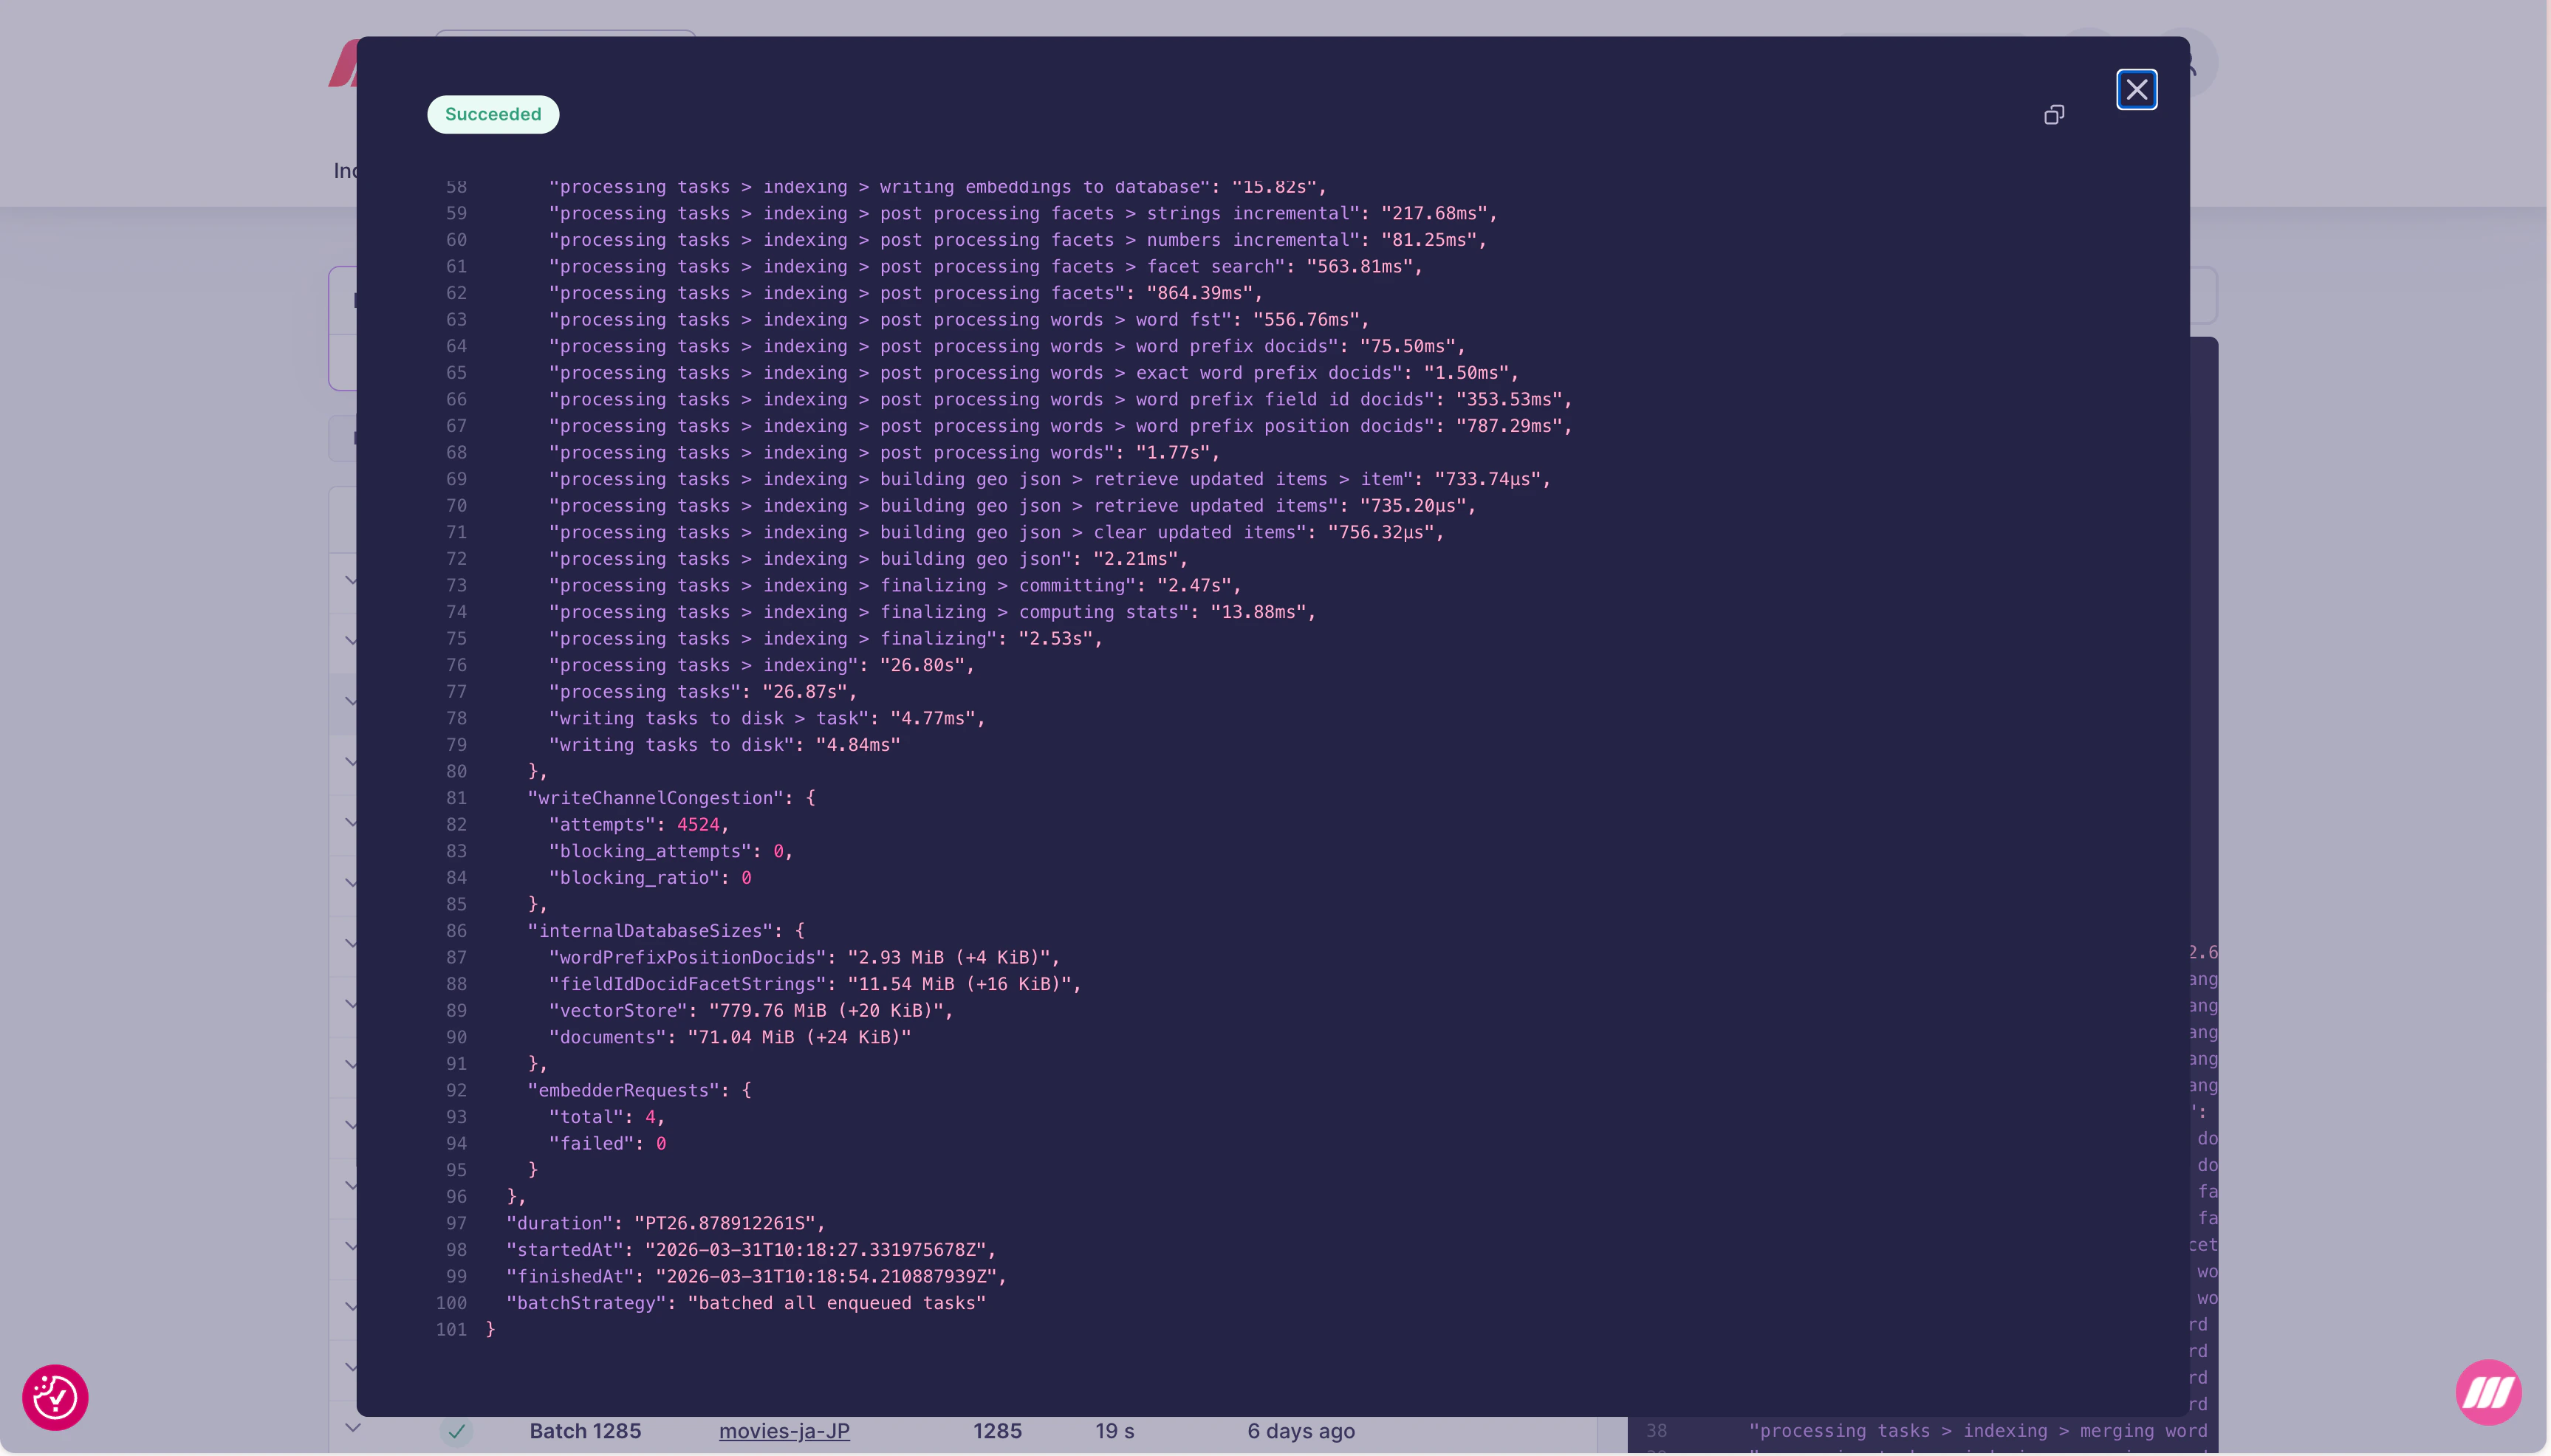
### Progress trace
The details page includes a `progressTrace` section with timing for every internal step of the indexing pipeline:
Each row shows:
* **Status**: succeeded, failed, or in progress
* **Index id**: which index was written to
* **Batch id**: unique identifier for the batch
* **Duration**: total wall-clock time for the batch
* **Started date**: when the batch began processing
Click a batch to open its details page.
### Progress trace
The details page includes a `progressTrace` section with timing for every internal step of the indexing pipeline:
 Key steps visible in the trace:
| Trace path | What it measures |
| -------------------------------------------------------------- | -------------------------------------------- |
| `processing tasks > retrieving config` | Loading index configuration |
| `processing tasks > computing document changes` | Diff between incoming and existing documents |
| `processing tasks > reading payload stats` | Parsing incoming document payloads |
| `processing tasks > indexing > extracting documents` | Extracting fields from documents |
| `processing tasks > indexing > extracting facets` | Building facet data |
| `processing tasks > indexing > merging facets` | Merging facet updates into the index |
| `processing tasks > indexing > extracting words` | Tokenizing document content |
| `processing tasks > indexing > merging words` | Merging word data into the inverted index |
| `processing tasks > indexing > writing embeddings to database` | Persisting vector embeddings |
| `processing tasks > indexing > post processing facets` | Finalizing facet search structures |
| `processing tasks > indexing > post processing words` | Finalizing word prefix structures |
| `processing tasks > indexing > building geo json` | Building geo search structures |
| `processing tasks > indexing > finalizing` | Committing the batch to disk |
| `writing tasks to disk` | Persisting the task record |
### Internal database sizes
The Internal DB table shows the current on-disk size of each internal data structure, along with the delta from this batch:
| Field | What it stores |
| -------------------------- | -------------------------------------------- |
| `wordPrefixPositionDocids` | Word prefix position data for prefix search |
| `fieldIdDocidFacetStrings` | Facet string data for filtering and faceting |
| `vectorStore` | Vector embeddings for semantic/hybrid search |
| `documents` | Raw document storage |
The delta (shown as `+N KiB` or `+N MiB`) tells you how much space each batch adds. A `vectorStore` growing much faster than `documents` indicates a high-dimensional embedding model.
### Other fields
| Field | What it shows |
| ------------------------------------------ | ------------------------------------------------------------------------------------------- |
| `embedderRequests.total` | Number of embedding API calls made during this batch |
| `embedderRequests.failed` | Failed embedding calls (non-zero means some documents may not be indexed for vector search) |
| `writeChannelCongestion.attempts` | Number of write attempts |
| `writeChannelCongestion.blocking_attempts` | Write attempts that had to wait (high values indicate write pressure) |
## Expert support for Enterprise customers
In most cases, the simplest way to improve indexing performance is to upgrade to a larger resource tier. More RAM and CPU directly reduce indexing time and TTS. You can change your resource tier at any time from the [project settings](/capabilities/platform/infrastructure/manage_resources).
If upgrading does not resolve the issue, the Meilisearch team can help. Enterprise customers have direct access to experts who can analyze your batch traces, database sizes, and index configuration to optimize for your specific workload. Contact [sales@meilisearch.com](mailto:sales@meilisearch.com) to learn more.
## Common issues and fixes
| Symptom | Likely cause | Fix |
| ----------------------------------------------- | ------------------------------------------------- | ------------------------------------------------------------------------------------------ |
| High TTS across all percentiles | Large document batches or many indexed attributes | Reduce batch size, or reduce the number of `filterableAttributes` and `sortableAttributes` |
| `merging words` step slow | Large inverted index update | Reduce the number of `searchableAttributes` or batch size |
| `writing embeddings to database` slow | High vector dimensions or large batch | Reduce batch size; consider a lower-dimension model |
| `embedderRequests.failed` non-zero | Embedder API errors or rate limits | Check your embedder configuration and API key validity |
| High `writeChannelCongestion.blocking_attempts` | Concurrent write contention | Avoid concurrent indexing operations on the same index |
| TTS spikes periodically | Scheduled bulk imports competing with search | Stagger indexing operations to off-peak hours |
| `vectorStore` growing faster than expected | High embedding dimensions | Switch to a lower-dimension embedding model |
Key steps visible in the trace:
| Trace path | What it measures |
| -------------------------------------------------------------- | -------------------------------------------- |
| `processing tasks > retrieving config` | Loading index configuration |
| `processing tasks > computing document changes` | Diff between incoming and existing documents |
| `processing tasks > reading payload stats` | Parsing incoming document payloads |
| `processing tasks > indexing > extracting documents` | Extracting fields from documents |
| `processing tasks > indexing > extracting facets` | Building facet data |
| `processing tasks > indexing > merging facets` | Merging facet updates into the index |
| `processing tasks > indexing > extracting words` | Tokenizing document content |
| `processing tasks > indexing > merging words` | Merging word data into the inverted index |
| `processing tasks > indexing > writing embeddings to database` | Persisting vector embeddings |
| `processing tasks > indexing > post processing facets` | Finalizing facet search structures |
| `processing tasks > indexing > post processing words` | Finalizing word prefix structures |
| `processing tasks > indexing > building geo json` | Building geo search structures |
| `processing tasks > indexing > finalizing` | Committing the batch to disk |
| `writing tasks to disk` | Persisting the task record |
### Internal database sizes
The Internal DB table shows the current on-disk size of each internal data structure, along with the delta from this batch:
| Field | What it stores |
| -------------------------- | -------------------------------------------- |
| `wordPrefixPositionDocids` | Word prefix position data for prefix search |
| `fieldIdDocidFacetStrings` | Facet string data for filtering and faceting |
| `vectorStore` | Vector embeddings for semantic/hybrid search |
| `documents` | Raw document storage |
The delta (shown as `+N KiB` or `+N MiB`) tells you how much space each batch adds. A `vectorStore` growing much faster than `documents` indicates a high-dimensional embedding model.
### Other fields
| Field | What it shows |
| ------------------------------------------ | ------------------------------------------------------------------------------------------- |
| `embedderRequests.total` | Number of embedding API calls made during this batch |
| `embedderRequests.failed` | Failed embedding calls (non-zero means some documents may not be indexed for vector search) |
| `writeChannelCongestion.attempts` | Number of write attempts |
| `writeChannelCongestion.blocking_attempts` | Write attempts that had to wait (high values indicate write pressure) |
## Expert support for Enterprise customers
In most cases, the simplest way to improve indexing performance is to upgrade to a larger resource tier. More RAM and CPU directly reduce indexing time and TTS. You can change your resource tier at any time from the [project settings](/capabilities/platform/infrastructure/manage_resources).
If upgrading does not resolve the issue, the Meilisearch team can help. Enterprise customers have direct access to experts who can analyze your batch traces, database sizes, and index configuration to optimize for your specific workload. Contact [sales@meilisearch.com](mailto:sales@meilisearch.com) to learn more.
## Common issues and fixes
| Symptom | Likely cause | Fix |
| ----------------------------------------------- | ------------------------------------------------- | ------------------------------------------------------------------------------------------ |
| High TTS across all percentiles | Large document batches or many indexed attributes | Reduce batch size, or reduce the number of `filterableAttributes` and `sortableAttributes` |
| `merging words` step slow | Large inverted index update | Reduce the number of `searchableAttributes` or batch size |
| `writing embeddings to database` slow | High vector dimensions or large batch | Reduce batch size; consider a lower-dimension model |
| `embedderRequests.failed` non-zero | Embedder API errors or rate limits | Check your embedder configuration and API key validity |
| High `writeChannelCongestion.blocking_attempts` | Concurrent write contention | Avoid concurrent indexing operations on the same index |
| TTS spikes periodically | Scheduled bulk imports competing with search | Stagger indexing operations to off-peak hours |
| `vectorStore` growing faster than expected | High embedding dimensions | Switch to a lower-dimension embedding model |